
This is one amazing fact that how rapidly things are turning towards the digital pace. Be it the business marketing strategies or the promotional tactics of services over social media, digital marketing has taken over the entire world.
The pandemic of coronavirus has transformed the entire way in which we could ever have thought about the future. From the creation of effective visual content to communication via different channels, digitalization is quickly capturing the minds of people.
The audience is always found interested in reading reports about major aspects of inbound marketing, content marketing, online behavior, preferences, and social media. At the end of each year, such reports and infographics become a highlight over the internet. And people love to read surprising statistics about their favorite social topic.
Do you want to read these reports and infographics?
Have you also find them engaging and addictive?
Always looking for some mind-blowing statistics and reports?
Well, this is not the only case! All of us are somewhere has the interest to read different reports about digital topics. And when it is about infographics, charts, and pictorial representation of some facts, this becomes easier to understand the statistics of growing digital platforms.
10 VISUAL MARKETING STATISTICS THAT YOU MUST KNOW BEFORE 2022:
In this short-fix guide, we are going to talk about the 10 visual marketing statistics that you must know before the end of 2021.
But wait, are you having any idea about the visual marketing concepts?
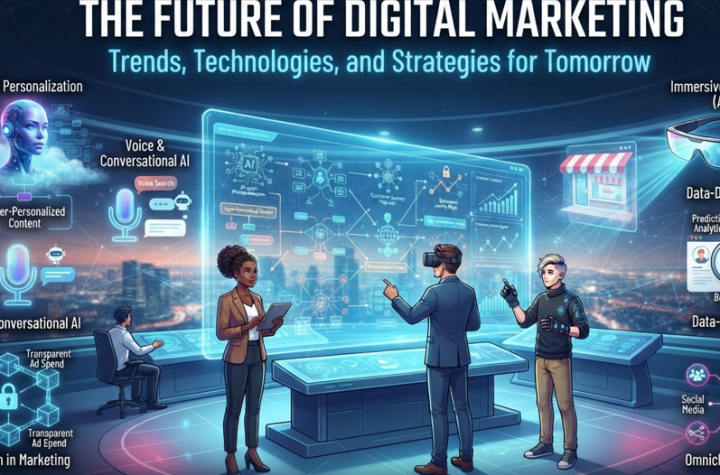
Let’s gear you up quickly with the idea of visual marketing.
Basically, visual marketing is the use of images, videos, and different types of multimedia content. The usage of these could strengthen your brand image. This could communicate your message clearly to the targeted audience. With the help of a visual marketing strategy, you can depict different subjects and concepts. And these are quite harder to approach with text sometimes.
We have compiled up 10 visual marketing statistics about which an individual must be known before the start of 2022. We have divided the marketing statistics into five different categories and have shared a few stats about them beneath their category.
Before compiling these marketing stats, we rounded up the reviews of different marketers along with the opinion of expert marketers from professional CV maker and personal website makers. We asked these marketers about how content marketing and digitalization along with technology innovation are bringing a boost to the brands.
Upon their answers, we simplified the statistics and are presenting you a fool-proof report about diverse categories of marketing. Let’s get into the study.
General visual content statistics:
- 70% of companies are looking to invest in content marketing. This could include visual marketing strategies as 40% of marketers think that between 51% and 80% of businesses will completely rely on visual content in 2022. This has been noticed that design and visual content is the biggest challenge for 23.7% of content marketers
- 49% of marketers rate visual marketing as one of the most important pillar of their marketing strategy, and 22% consider it a little less vital, and 19% believe that their strategy is nothing without infusing visual content. When people hear information from somewhere, they are most likely to remember only 10% of that information. But, if a related post is attached with that same information, people would remember 65% of the information with picture.
Video marketing statistics:
- 70% of YouTube viewers watch videos to get the help for their problem that they are having in their daily life. Global figures show that YouTube is consumers’ leading source of video content, and stands first with 83% (Facebook stands second, at 67%).
- Video streaming has increased phenomenally in the last few years. 54% of consumers have reported to see more video content from a brand or business they like.
Emerging visual marketing statistics:
- Spending on VR for a brand and business is expected to rise $9.2 billion in 2021 that would be outpacing its use for leisure. This shows the rise in VR technology and its use.
- 64% of consumers have spoken, VR has the most potential in gaming, and 52% consider its potential in film and TV. According to the statistics, 73% of videos are two minutes or less in length. Also, 85% of adults consume content on different devices at the same moment like attaching mobile and smart TV together and due to this rate, 57% of marketers are using the option of live video.
Infographics statistics:
- People who follow the directions with text and illustrations perform 323% better than people who follow the directions without listening and watching illustrations. Experts have also suggested to take Ryan Robinson’s guide on how to start a blog as an example. In the blog, he teaches readers the process of creating a blog through a blend of text, illustrations and infographics.
- Infographics have had the biggest boost in usage among B2B marketers in the last four years — now standing at 67%.
Social media statistics:
- 70% of audience upon the survey said they watched Facebook Stories more often than Instagram or Snapchat Stories. More than 500 million Instagram accounts put on story each day, and 4 million brands use stories ads by each month. 58% audience also commented they got more interested in a brand or certain product after seeing it in Instagram stories.
- 69% of consumers watch online videos with their devices sound off. Tweets with videos get 10 times more engagement of audience. 72% of teenagers use Instagram and 69% use Snapchat. Both the social media platforms and their use has increased by more than 20% since 2015. As per the observation, there are more than 500 million Instagram users active every day and Snapchat had 249 million daily active Snapchat users in 2020. With the trend of LinkedIn profile service, LinkedIn also saw an increase in users over the years.
PARTING SHOT:
This quick statistics guide is encompassing the experts’ reviews and extracted marketing statistics. And you should be knowing these before the end of 2021. Each year, we all wait for the newer marketing topics and look for the growing brands and their revenues. Such statistics guide would be a help to the public who is interested to know about the information of developing technologies and platforms.


More Stories
The Future of Digital Marketing: How AI is Driving Better Results
The Rise of Zero-Click Marketing: How Brands Stay Visible Without Website Visits
Top 10 Digital Marketing Agencies for Business Growth and Online Success